Stories
What you can do with Nexju
Six things people come to Nexju for, step by step, with the screens from real runs on the Allen Ancient DNA Resource.
Model a population with qpAdm
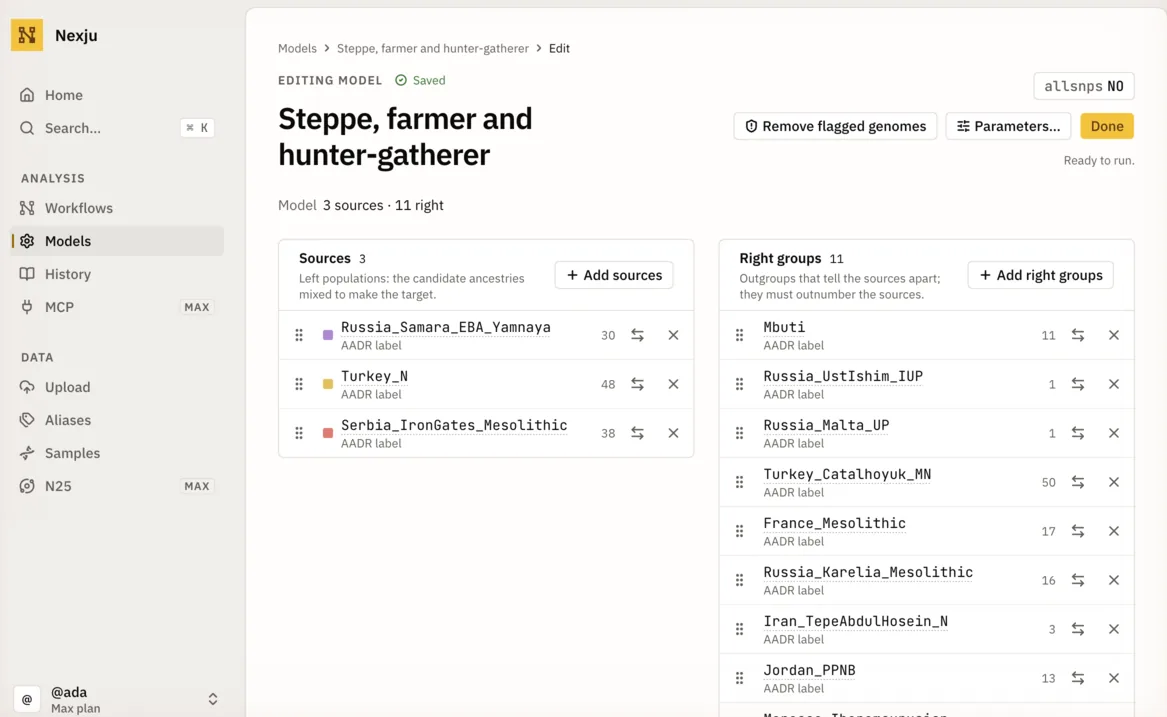
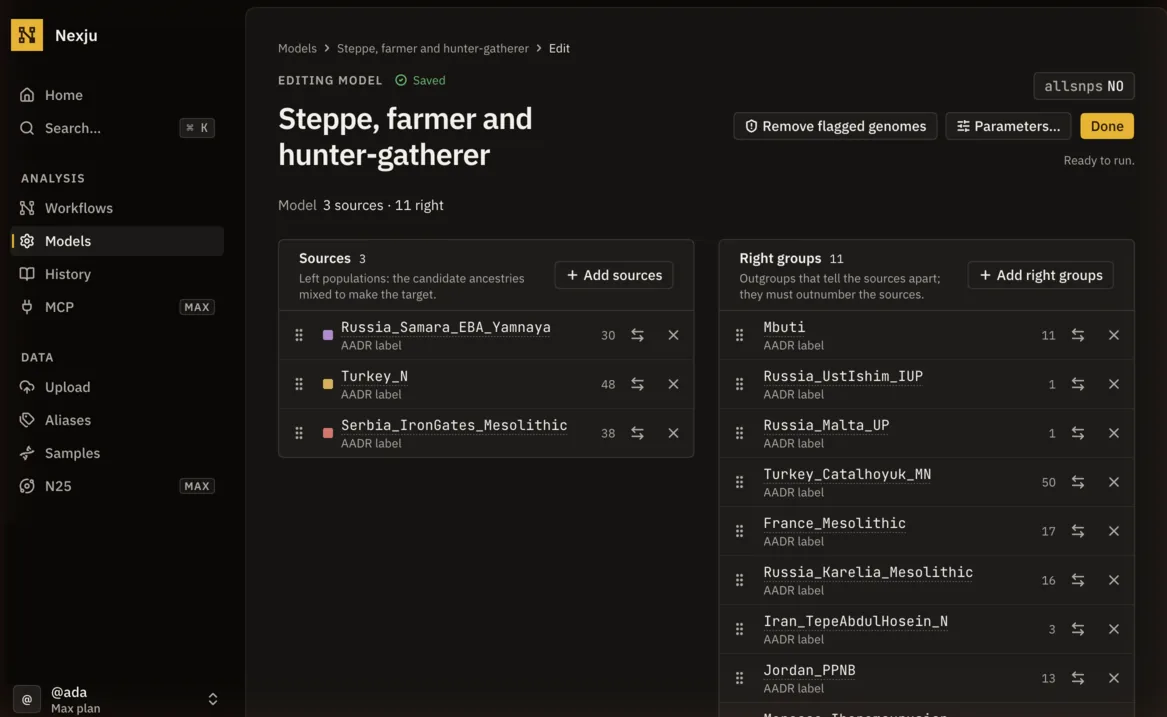
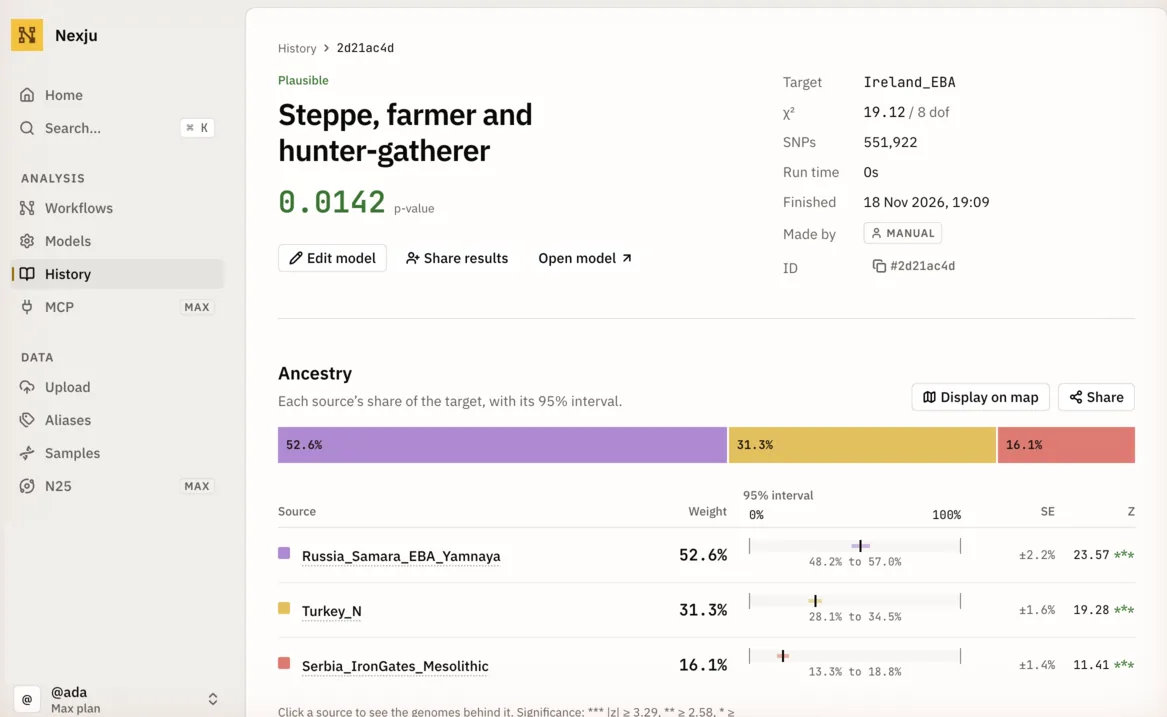
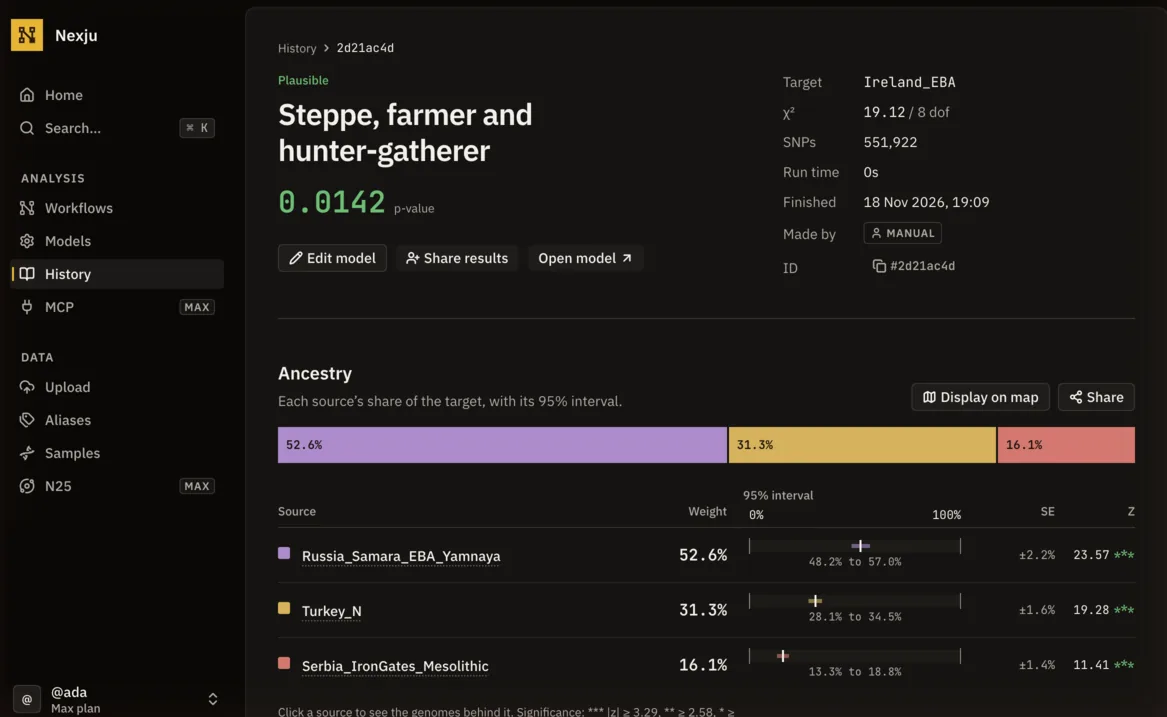
Which ancient peoples does a population descend from, and in what proportions? This model explains Early Bronze Age Ireland as a mix of steppe herders, Anatolian farmers and hunter-gatherers.
Name the target and the sources. You find populations in the AADR by label, date or place, and each one shows how many genomes it has.
Add right groups, the outgroups that tell the sources apart. Nexju suggests some, and flags genomes the AADR marks as questionable.
Press Run. The result shows the weights with their 95% intervals and z-scores, the χ², the p-value and a verdict at your threshold.
Run one model on many targets
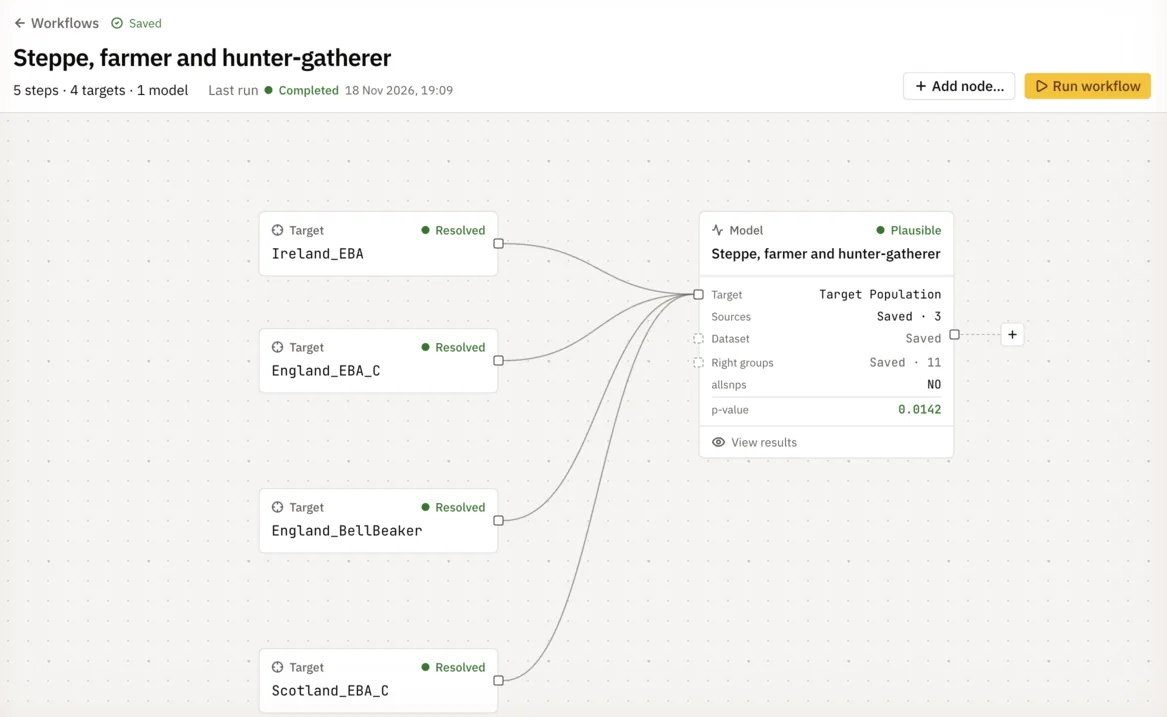
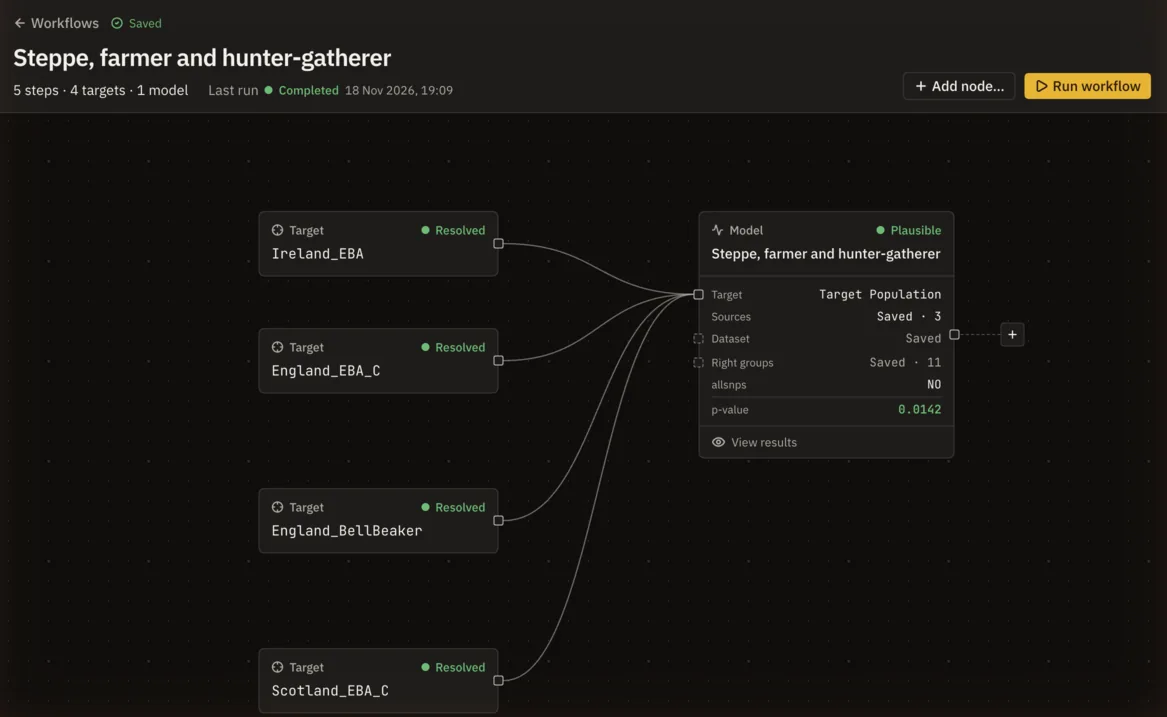
A model fits one Bronze Age population. A workflow tests the same model on its neighbours, so you build the model only once.
Add each target to a workflow. A target can be a population, an alias of your own genomes or an uploaded DNA file.
Wire the targets into the saved model on the canvas.
Run the workflow. Each target gets its own fit, and the canvas marks every step that changed since the last run.
Compare your own DNA with ancient genomes
A raw DNA file from 23andMe, AncestryDNA or MyHeritage can be the target of any model. Fit it to see which ancient populations explain your own genome.
Upload the file once, on the Upload page.
Pick it as the target of any model, in place of a population.
Press Run. Nexju merges your genome only with the populations the model uses, so it never rewrites the whole AADR.
Place ancient genomes on a PCA
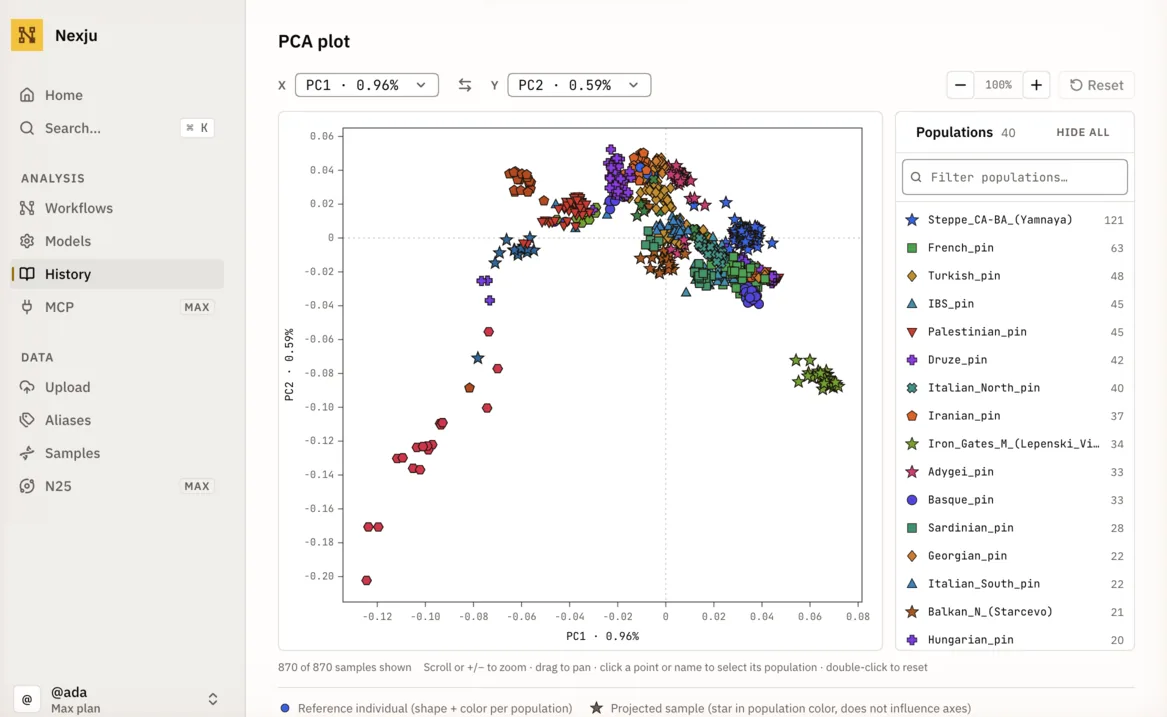
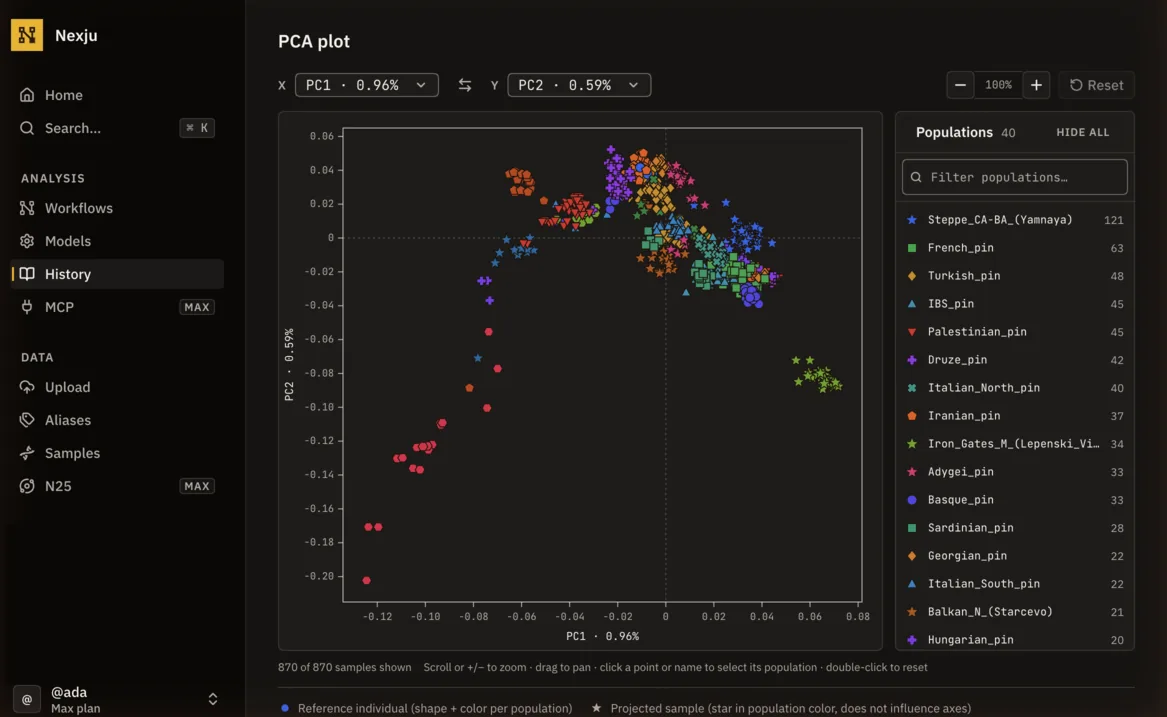
See where ancient populations sit among present-day ones, on axes built from populations you choose.
Pick the reference populations that set the axes.
Add the ancient genomes, or your own, to project onto those axes. Shrinkmode and outlier removal are optional.
Run smartpca, then zoom, swap axes and pick out populations on the plot.
Break a population down genome by genome
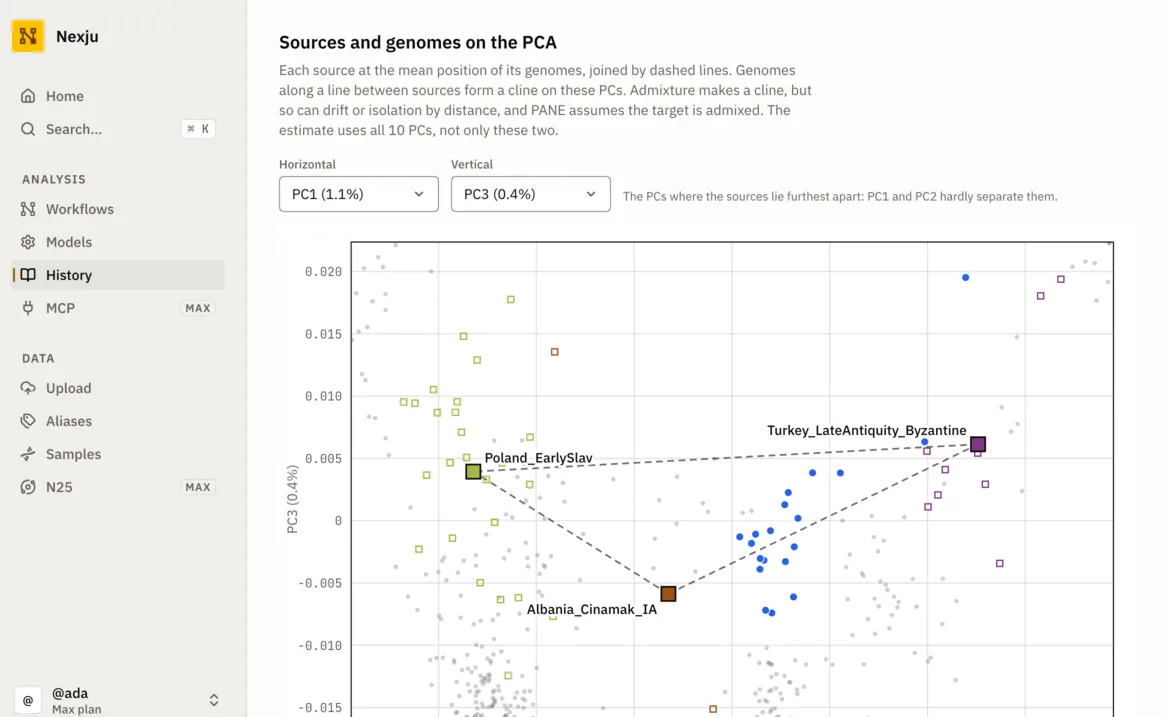
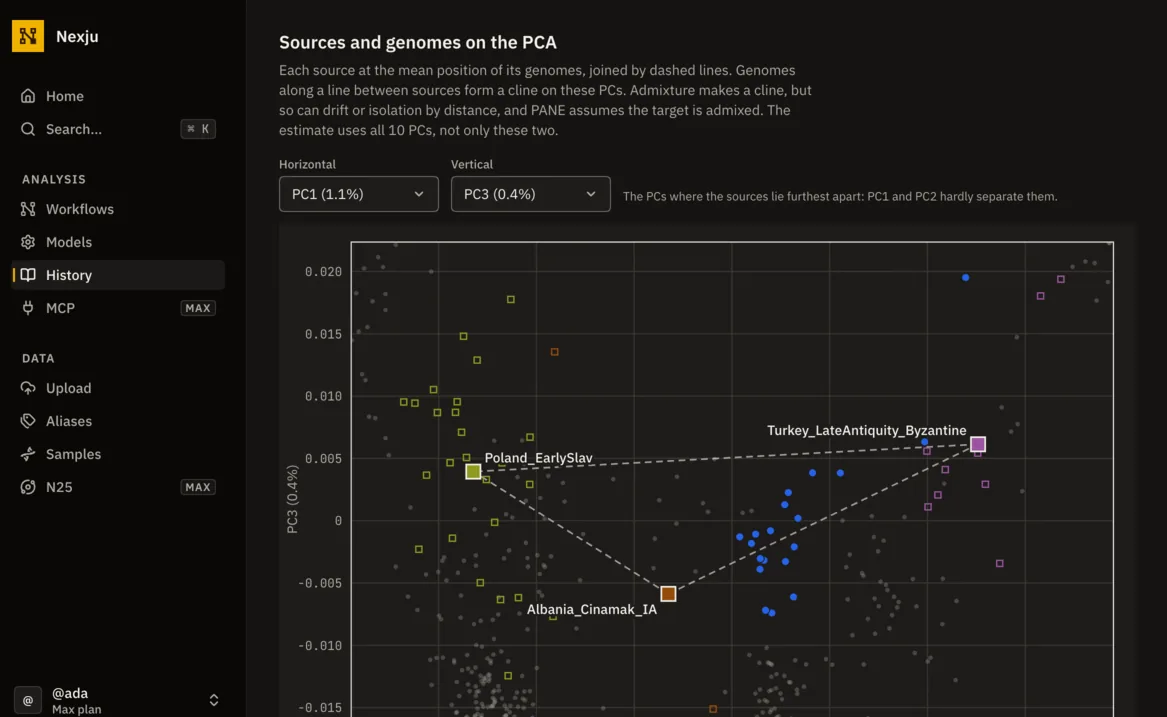
Nineteen present-day Greek genomes don’t share one mix. PANE shows how much each draws from Iron Age Albania, Byzantine Anatolia and Early Slavs.
Pick two or more sources and a population with several genomes.
Run PANE. It places every genome on the PCA and estimates its share of each source.
Compare the genomes. PANE is quick but rough, so fit any share you report with qpAdm.
Date when two ancestries mixed
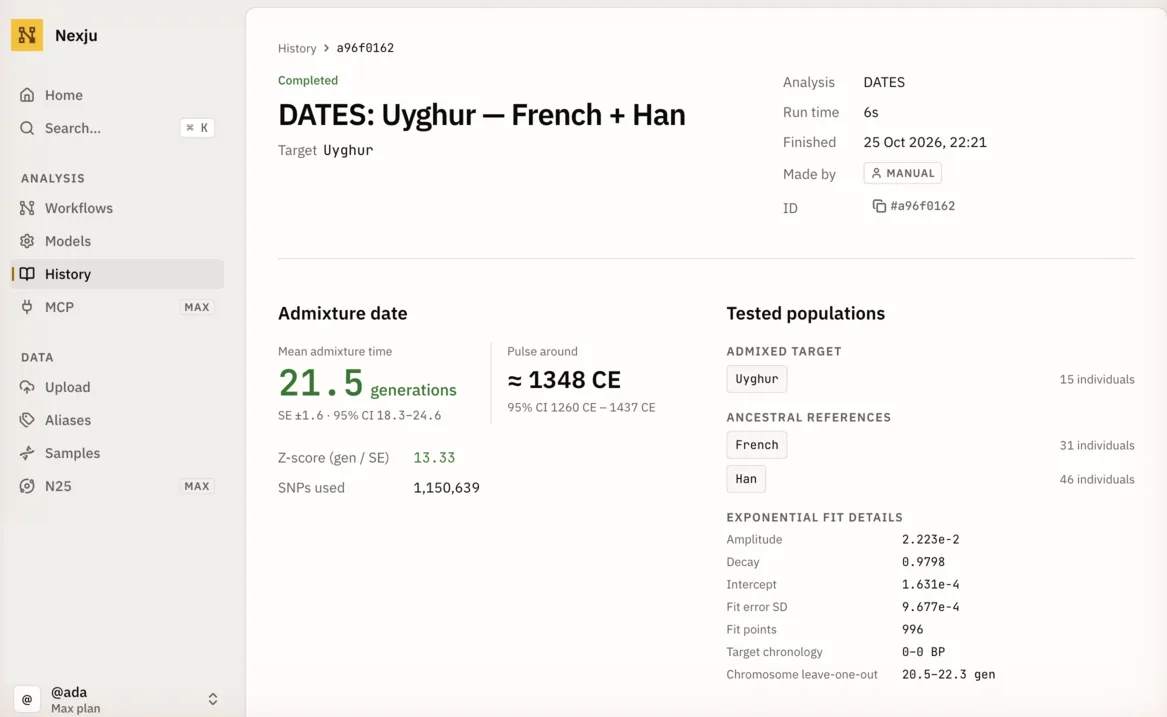
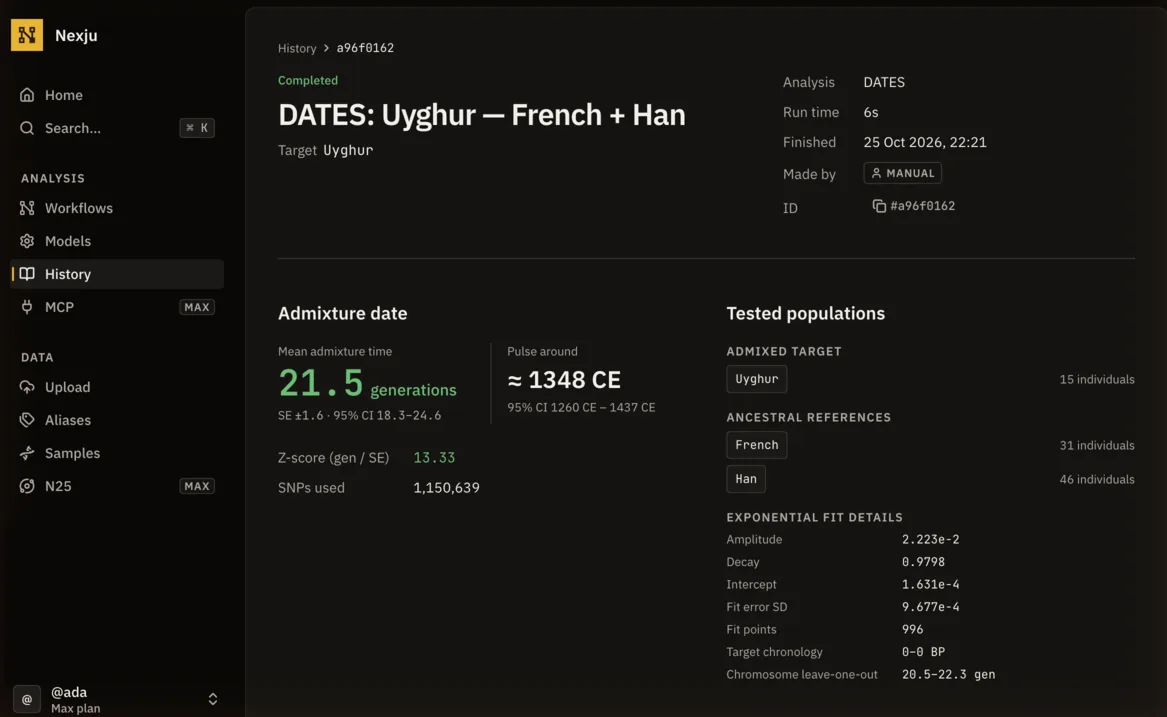
When a population is a mixture of two ancestries, DATES estimates when they mixed. This run dates the Uyghur mixture of French-like and Han-like sources.
Name the admixed target and its two sources.
Run DATES. It fits the decay of ancestry linkage disequilibrium along the genome.
Read the date in generations and in calendar years, with its 95% interval and the fit behind it.
Run your first model
The free plan runs qpAdm, qpWave and f-statistics on the whole AADR, with nothing to install.